
The Top KPIs All Retail Brands Need to Track in 2024
Research shows that companies that tracked their key metrics were twice as likely to hit their goals than companies that did not. Here are the KPIs we think retailers should track in 2024.

In the ever-evolving landscape of retail, understanding and monitoring Key Performance Indicators (KPIs) is often the difference between winning and losing against your competition. Research shows that companies that tracked their key metrics were twice as likely to hit their goals than companies that did not. Despite this correlation to retail success, many businesses end up not tracking their KPIs for the usual reasons why they don’t do analytics in the first place.
But the beauty of KPIs is that they are a limited set of quantifiable measurements that help retailers gauge the health of their business. Like a person’s blood pressure number that can reveal the general state of your health, the right KPI can be a singular metric that indicates whether your brand is likewise healthy or not. For retail stores, KPIs serve as a navigational compass, pointing towards areas that are performing well and those that require attention. In a highly competitive market, having a clear insight into these indicators can be the difference between thriving and merely surviving. By closely monitoring KPIs, retailers can optimize their operations, enhance customer satisfaction, and ultimately, boost their bottom line.
So you should track all the KPIs, right? The more the better?
How Many KPIs Should Your Retail Brand Track?
Like with Little League, if everyone is special, then no one is (at least, that was the reasoning why some of us didn’t get trophies). No performance indicator can be key, if there are just so many of them that nothing particularly stands out. The whole idea of KPIs is to whittle down all your metrics to the few select ones that really indicate the health of your retail business.
In fact, it can be detrimental to track too many KPIs as “they become redundant and difficult to interpret.” Instead, your business should figure out the exact KPIs that truly matter, and keep the number down to between 3 and 5 max. Typically, that is the sweet spot to get enough of a breadth of performance while keeping tracking manageable.
Of course, this doesn’t mean that all the other metrics are being ignored. Rather, KPIs are the “canary in the coal mine” that indicate big problems. Your complete set of metrics that should always be automatically tracked are what your team can drill down into in order to diagnose the issues that your KPIs are bringing up.
So which KPIs should your business track? While there are no blanket metrics to cover all the unique needs of each retail brand, there are a few that have proven effective for thousands of businesses to monitor.
Year-Over-Year Growth
One of the most telling KPIs for retail is year-over-year (YoY) growth. This metric compares a store's performance in the current year to that in the previous year, offering insights into the business's overall health and trajectory. A consistent increase in YoY growth indicates that the store is expanding and successfully attracting more customers or increasing sales.
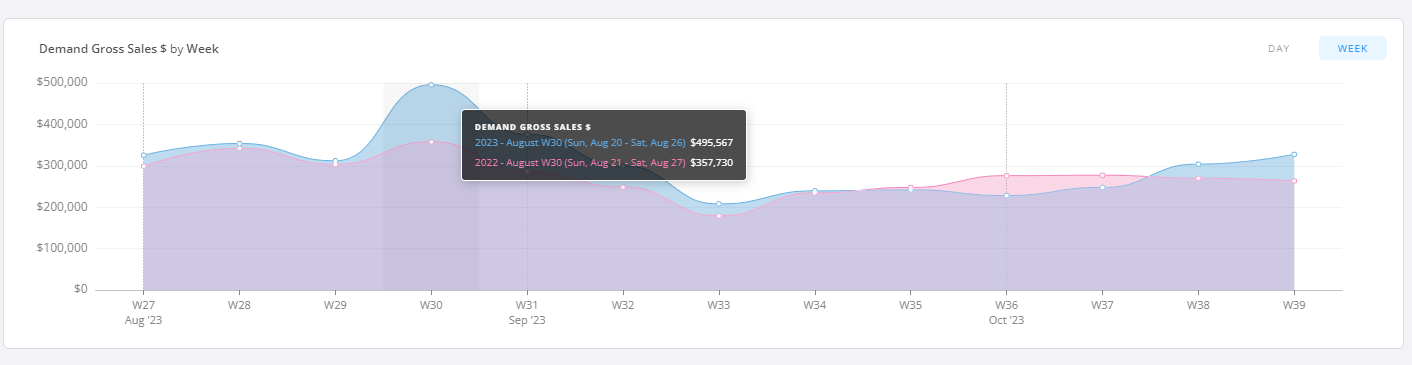
However, it's not just about positive growth; understanding the reasons behind a decline is equally important. A decrease in YoY growth could signal issues like market saturation, increased competition, or changing consumer preferences. Retailers must analyze this KPI in the context of broader market trends and internal factors to develop effective strategies for sustained growth.
Conversion Rate
The conversion rate is often a critical KPI that measures the percentage of visitors to a retail store or website who make a purchase. This metric is essential for understanding the effectiveness of your sales and marketing strategies. A high conversion rate means that your store is successfully turning visitors into buyers, which is a strong indicator of effective customer engagement and product-market fit.
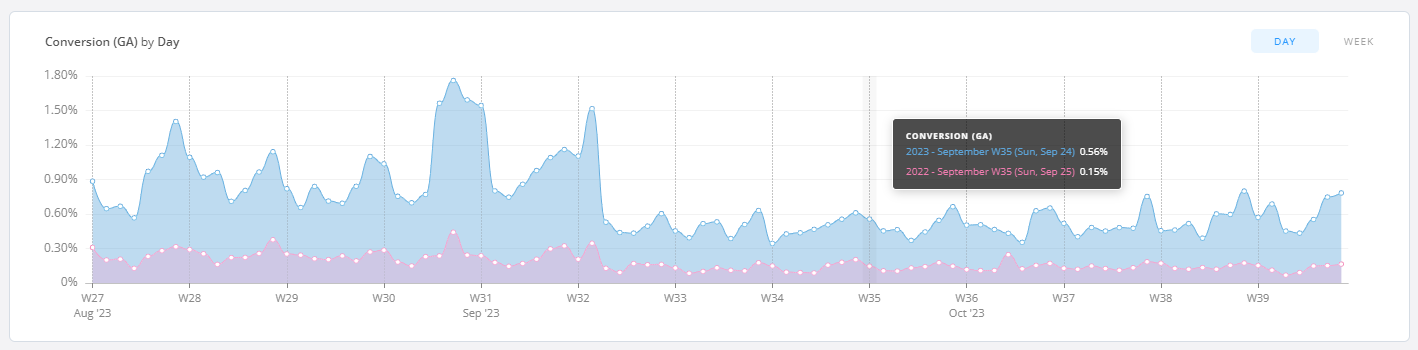
On the other hand, a low conversion rate might suggest issues with pricing, product selection, customer experience, or marketing efforts. Retailers need to delve into this KPI to identify areas for improvement. By optimizing the factors influencing the conversion rate, stores can significantly increase their sales and profitability.
Average Order Value (AOV)
Average Order Value (AOV) is a key metric for assessing how much money customers spend on an average transaction. This KPI helps retailers understand customer purchasing behavior and set pricing and marketing strategies accordingly. A higher AOV indicates that customers are purchasing more expensive items or buying in larger quantities, which can lead to increased revenue.
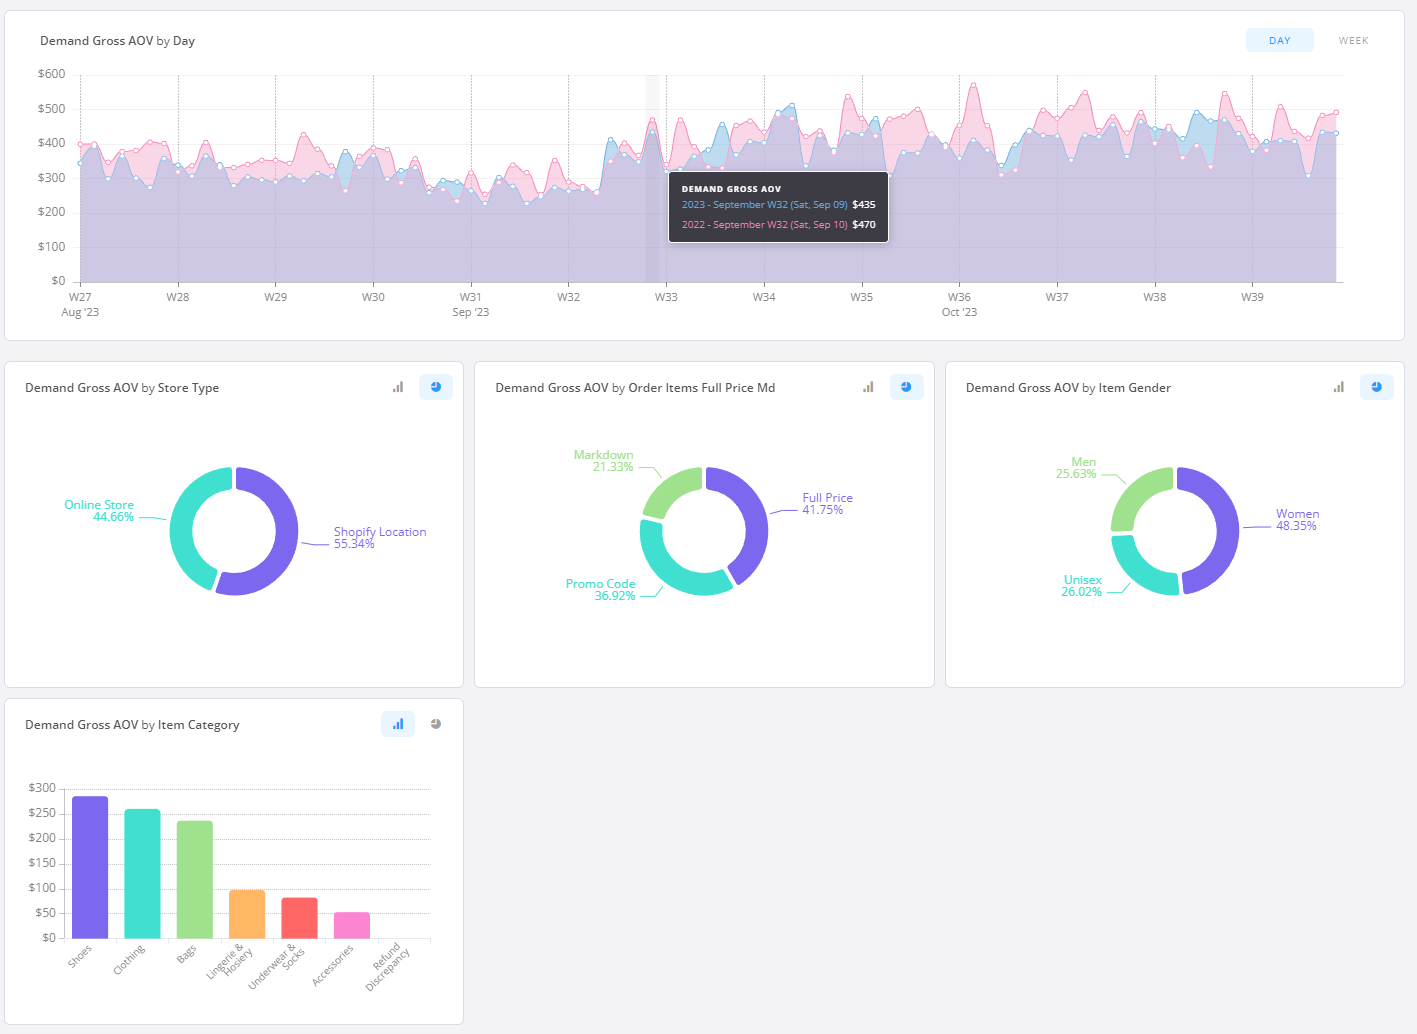
To boost AOV, retailers might consider strategies like cross-selling and upselling, improving product quality, or offering bundle deals. Tracking changes in AOV over time can provide valuable insights into how changes in strategy impact customer spending habits.
Return Rate
The return rate is a crucial KPI for retail businesses, indicating the percentage of products sold that are returned by customers. A high return rate can be a warning sign, pointing to issues such as poor product quality, inaccurate product descriptions, or customer dissatisfaction. It's essential for retailers to monitor this metric closely and understand the reasons behind returns. With returns becoming a larger problem for retailers, especially on the ecommerce side of things, keeping this metric in mind can be crucial to identify losses that don’t normally show up in sales data.
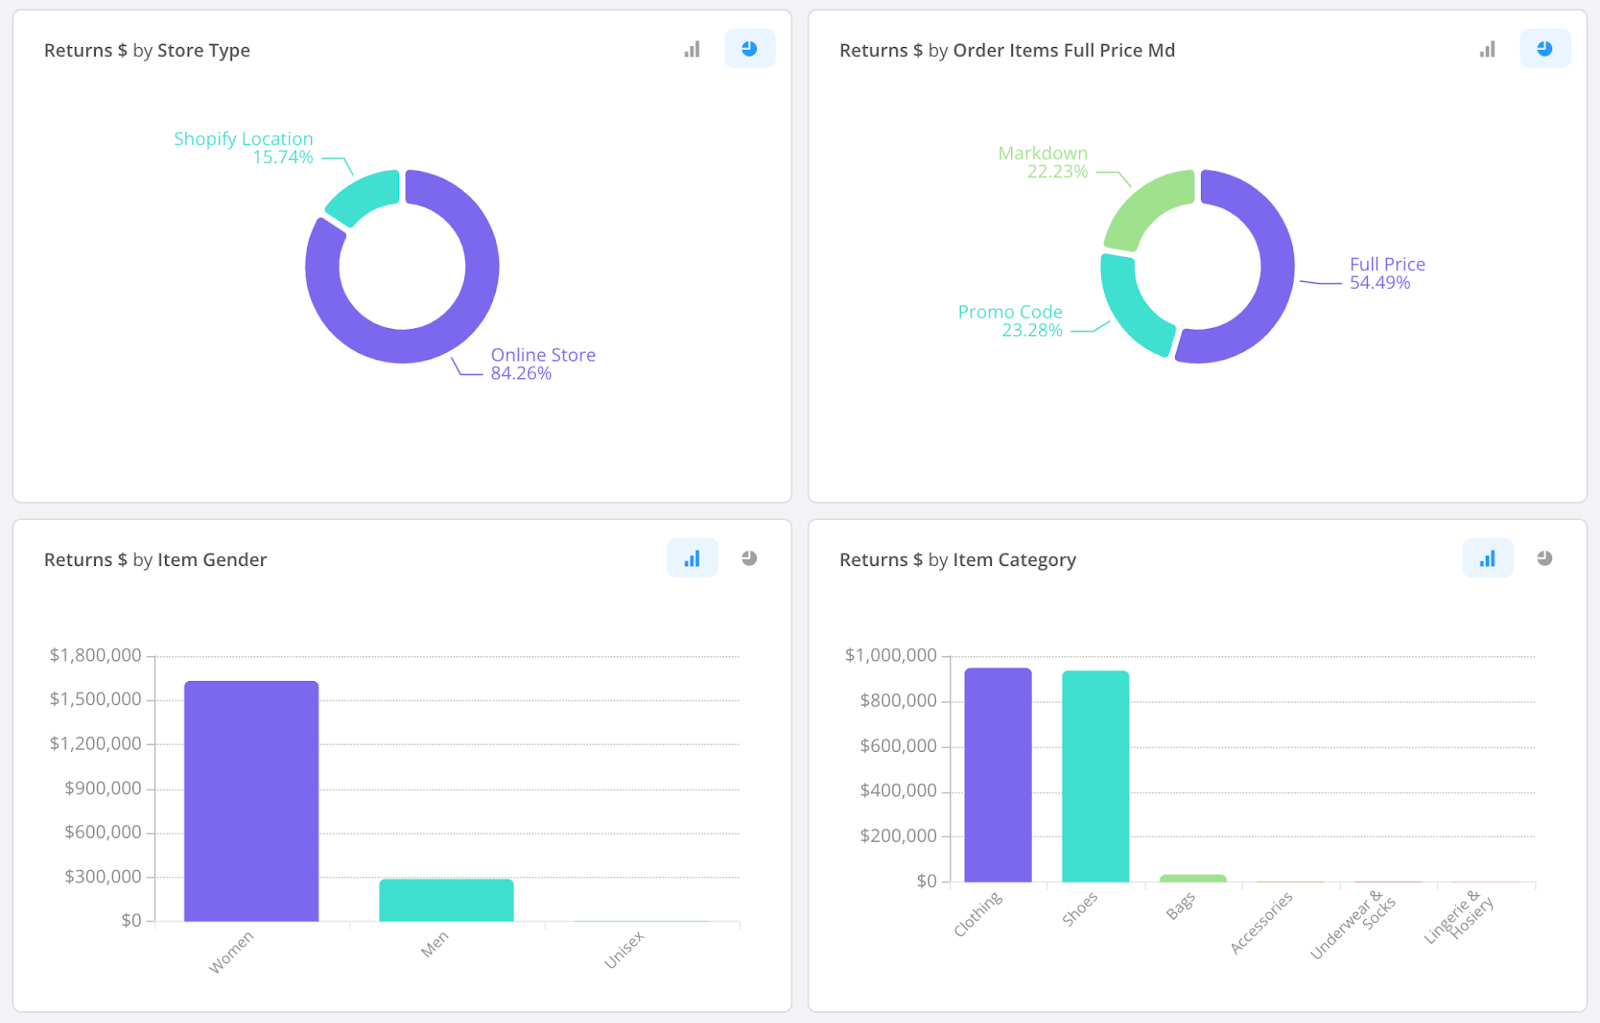
By addressing the root causes of high return rates, retailers can improve product quality, enhance customer satisfaction, and reduce the costs associated with returns processing. This, in turn, can lead to improved customer loyalty and a better bottom line.
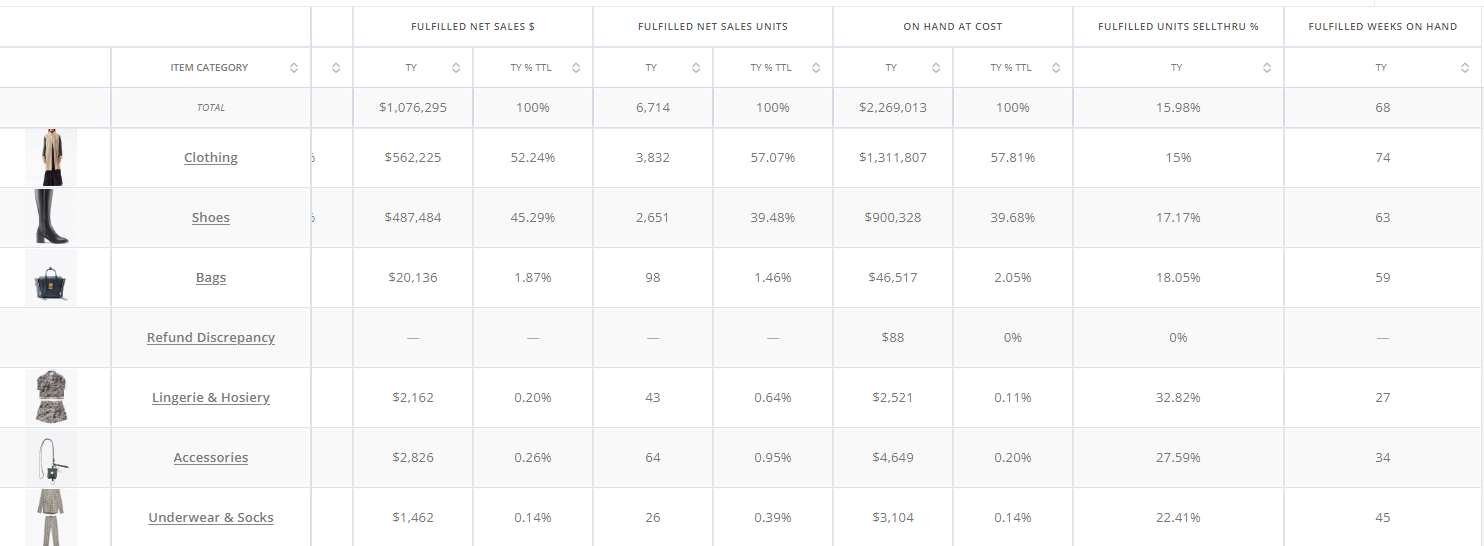
Sell Through Rate
Sell Through Rate can be an essential KPI that measures the percentage of inventory sold within a specific period compared to the amount of inventory received. It's a crucial indicator of inventory management efficiency and product demand, especially for retail businesses that expect to do high-volume sales with supply chain concerns. A high sell-through rate suggests that products are well-received and align with customer preferences, while a low rate may indicate overstocking or misalignment with market demands.
This single metric can help determine what specific products or product categories are working well for the brand, and which are not. Retailers should closely monitor this metric to optimize inventory levels, reduce carrying costs, and align product offerings with consumer trends. By adjusting purchasing and merchandising strategies based on the sell-through rate, retail brands can improve inventory turnover and profitability.
As the retail landscape continues to evolve, staying informed and adaptable is key. By diligently tracking and responding to your KPIs, retail brands can ensure they not only keep up with the market but set themselves apart as leaders in the industry in 2024. By focusing on metrics like Year-Over-Year Growth, Conversion Rate, Average Order Value, Return Rate, and Sell Through Rate, retailers can gain deep insights into their business performance.
Of course, these KPIs may not be the right ones for your brand. The future of retail is data-driven, and by embracing the right KPIs for you, your stores can confidently navigate the challenges and opportunities that lie ahead. And if you need help identifying your specific KPIs, we’re here to help.