
Making Cents from the $620 Billion Returns Problem
Any retail manager will tell you that accounting for returns is a hassle, and if they’re honest, many will admit that they don’t track returns data nearly as much as they should.

It’s hard to believe but it’s already mid-November and well into the holiday shopping season (and no, those Halloween decorations aren’t going to put away themselves). And if there are three truths in holiday shopping, it’s these:
- You’ll never get all your shopping done in November no matter how hard you try.
- Amazon gift cards will always be considered “low effort.”
- Someone’s probably going to return one of your gifts they said they “loved.”
That third issue may be a small annoyance for the average considerate shopper, but in aggregate, it’s a giant issue for the retail industry as a whole. In fact, Insider Intelligence forecasts that in 2023, retail returns will surpass $620 billion.
While returns are a necessary evil in retail, managing both the logistics and the cost of returns can be a major headache for retailers. On average, it costs 66% of the price of a $50 item to process a return, according to Optoro (via Axios). And since between 14% to 23% of apparel, accessories, and footwear are returned each holiday season, this can drastically change the bottom line for retail brands after Black Friday.
Why Returns Analytics & Accounting is Important
The difference between gross sales and net sales is sales returns and adjustments, the latter being refunds to the customer for reasons such as defective products. While the general concept of subtracting returns and allowances from gross sales is easy to understand, actually calculating it across all your products, all your stores, over many months (returns run through Q1 after all) can be incredibly complicated and time consuming.
For example, debiting a sales return on a $100 product isn’t as simple as subtracting $100 from your revenue. Many retailers neglect to account for the appropriate tax liability collected on the sale, which also has to be remitted. Similarly, there’s the cost of processing returns, which should be included in the calculations as well. After all, if the cost of processing a return averages 66%, that’s not a small sum to forget about.
There are further complications:
- Was there a discount on the original sale?
- Was only one product returned from a bundled package?
- Was the refund provided in cash or store credit?
- Was the return by mail or in-store, as they have different processing costs?
Any retail manager will tell you that accounting for returns is a hassle, and if they’re honest, many will admit that they don’t track returns data nearly as much as they should, even as they rely on their sales dashboards without correct returns data to perform their analytics.
In other words, retail sales teams could be making assumptions and even taking action on sales data that could be up to 30% wrong! That’s a recipe for a holiday disaster not seen since Christmas Vacation (ask your parents).
Reducing Returns Means Increasing Profit
The goal of returns analytics is to give retail teams insight into why returns occur and where they can be reduced, or even eliminated. Addressing the cause of returns isn’t simple either. According to econsultancy only 20% of retail returns are due to defective products, meaning that the majority of returns are due to other reasons such as products being the wrong size, or just due to customer shopping habits (some shoppers like to buy a lot of items and return a bunch of them).
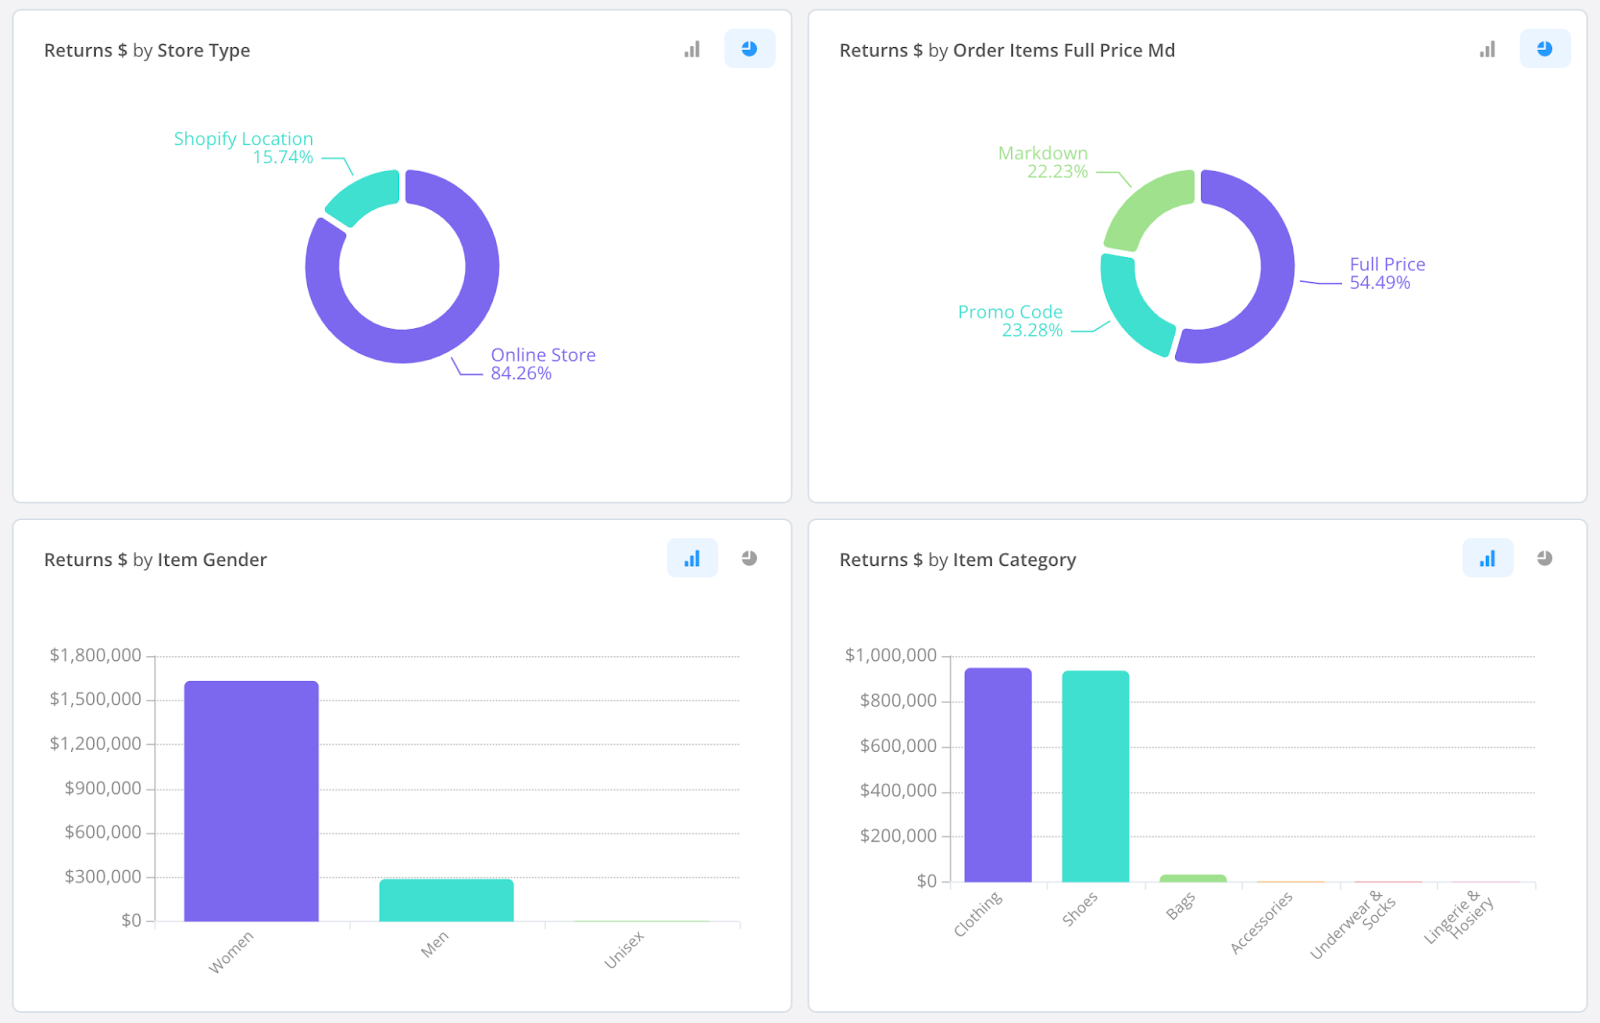
Good retail analytics can help pinpoint the why and where of your returns. By showing you which items saw the most returns, or which store saw the highest frequency of returns, or even returns by category, robust returns data can provide actionable insights into what can be done to reduce the rate of returns.
According to The Wall Street Journal, cutting returns in half could increase profits by about 25%. And since returns occur the most frequently during and after the holiday shopping season, it’s never more important than right now to make sure that your retail locations have easy access to their returns data.
Get Actionable Returns Data with 42
Sales numbers don’t mean much when they don’t incorporate this type of deep data. Your team isn’t getting a true sense of net revenue when the numbers literally don’t add up, nor can they take the right actions to mitigate glaring returns issues. In fact, many other popular returns apps such as Loop or Happy Returns may be causing discrepancies in your reporting. For example, with their processes, these apps often use gift cards or 100% discounts for the exchange, causing your AOV and Margin analytics to be skewed.
So if your team needs the most accurate returns data, that’s where 42 can help. Our one-click sales dashboard and reports reflect returns data and even roll up return reasons to help you better understand what moves the needle.
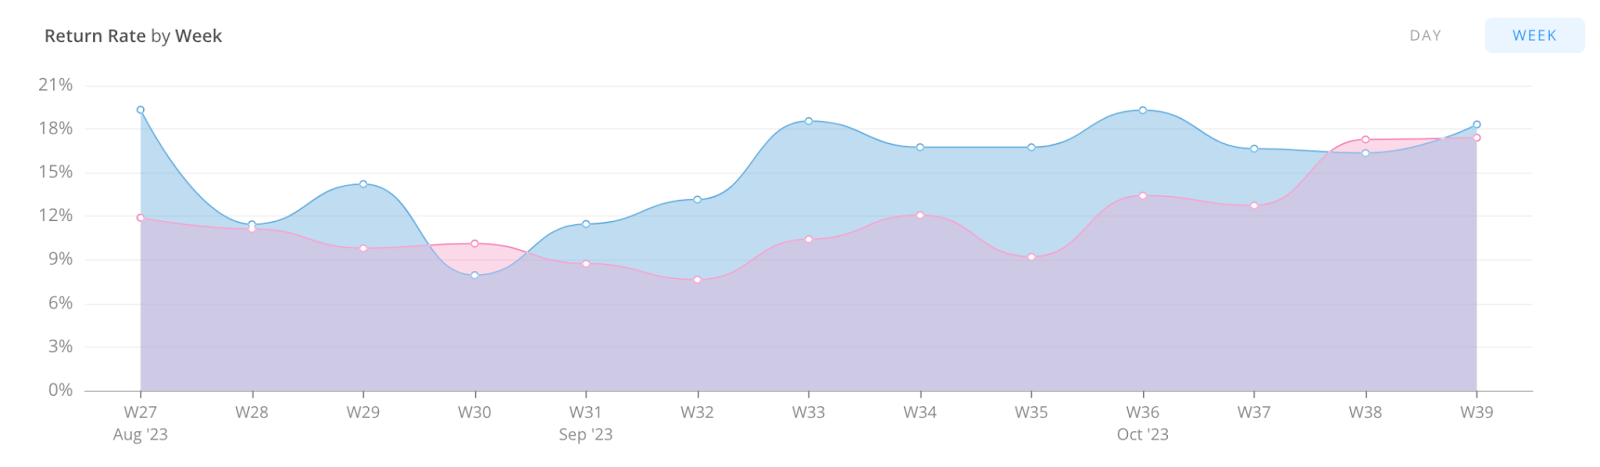
Our dashboard trends returns data so sales managers can see at-a-glance if there is a troubling trend of increasing returns rate:
Of course, better returns data is just a small part of the reporting capabilities our retail analytics platform has to offer. Our suite of real-time omnichannel data reporting is a crucial part of the success of hundreds of brands during this holiday shopping season, helping each team keep an eye on the most important KPIs that will put the happy in Happy Holidays.
So, is everyone in your team able to track return data? If not, we’re here to help.