
What Makes Analytics USELESS (and How To Avoid It)
There are a host of reasons why busy retail teams can’t be bothered with time consuming and repetitive reporting, especially when their time could be better used on tasks that materially affect the bottom line.

If you’re reading this, your retail team probably spends too much time creating reports and running analytics. According to a recent survey by Databox, more than 75% of companies spend 3 or more hours each month just making reports. In fact, 50% spend more than 6 hours a month! You might even be thinking to yourself “I wish I only spent 6 hours a month doing reporting.”
That might be because for retailers specifically, McKinsey reports that “merchants spent approximately two-thirds of their time gathering data, managing exceptions, “firefighting,” and participating in meetings to syndicate with colleagues.” That’s so much time spent wrestling with data, some retailers don’t even bother to engage in analytics.
But we all know that good analytics typically leads to positive ROI. The right data coupled with the right actionable insights can significantly move the needle. McKinsey also reports that companies that extensively use customer analytics are “significantly more likely to outperform the market,” and nearly double their profits.
The real problem lies in the amount of time it takes teams to pull reports and actually use analytics. Time is money, after all, and when it can take hours out of the day to clean data, pull reports (usually in Excel or Google Sheets), and analyze insights with your team; the ROI falls simply due to the amount of time that has to be sunk into the reporting process.
Why Humans Don’t Like Analytics
So we know analytics is good for us, yet so many businesses and their teams refuse to take their medicine. Why? Well, Harvard Business Review put it this way:
First, achieving data-driven leadership remains an aspiration for most organizations — just 26.5% of organizations report having established a data-driven organization. Second, becoming data-driven requires an organizational focus on cultural change. In this year’s survey, 91.9% of executives cite cultural obstacles as the greatest barrier to becoming data driven. - HBR (emphasis ours)
In essence, analytics is not easy. It’s annoying to have to pull reports, play with numbers, and do it over and over again. If the culture of a company eschews this type of work, or hasn’t built it into the fabric of their workflow (yet), then it’s an extreme challenge to steer employees to be data-driven.
The other big problem is managing data quality. A survey of more than 300 data professionals by Monte Carlo (via venturebeat) showed that on average, 40% of their time is spent evaluating or checking data quality. And when data incidents occurred, it took nine hours on average to fix things. Basically, managing data is a huge chore; but without good data, you don’t get good analytics.
Then you have the Excel factor. Just mentioning that word might already set some of your eyes twitching. Nearly every team has Excel (or Google Sheets) fatigue, and for good reason. They’re not easy to use, there are a ton of them, and some studies show that more than 90% of spreadsheets contain errors.
There are just a host of reasons why busy retail teams can’t be bothered with time consuming and repetitive reporting, especially when their time could be better used on tasks that materially affect the bottom line. But the Catch-22 is that good analytics will materially affect the bottom line.
So what’s the solution?
Automated, Intuitive Reporting with 42
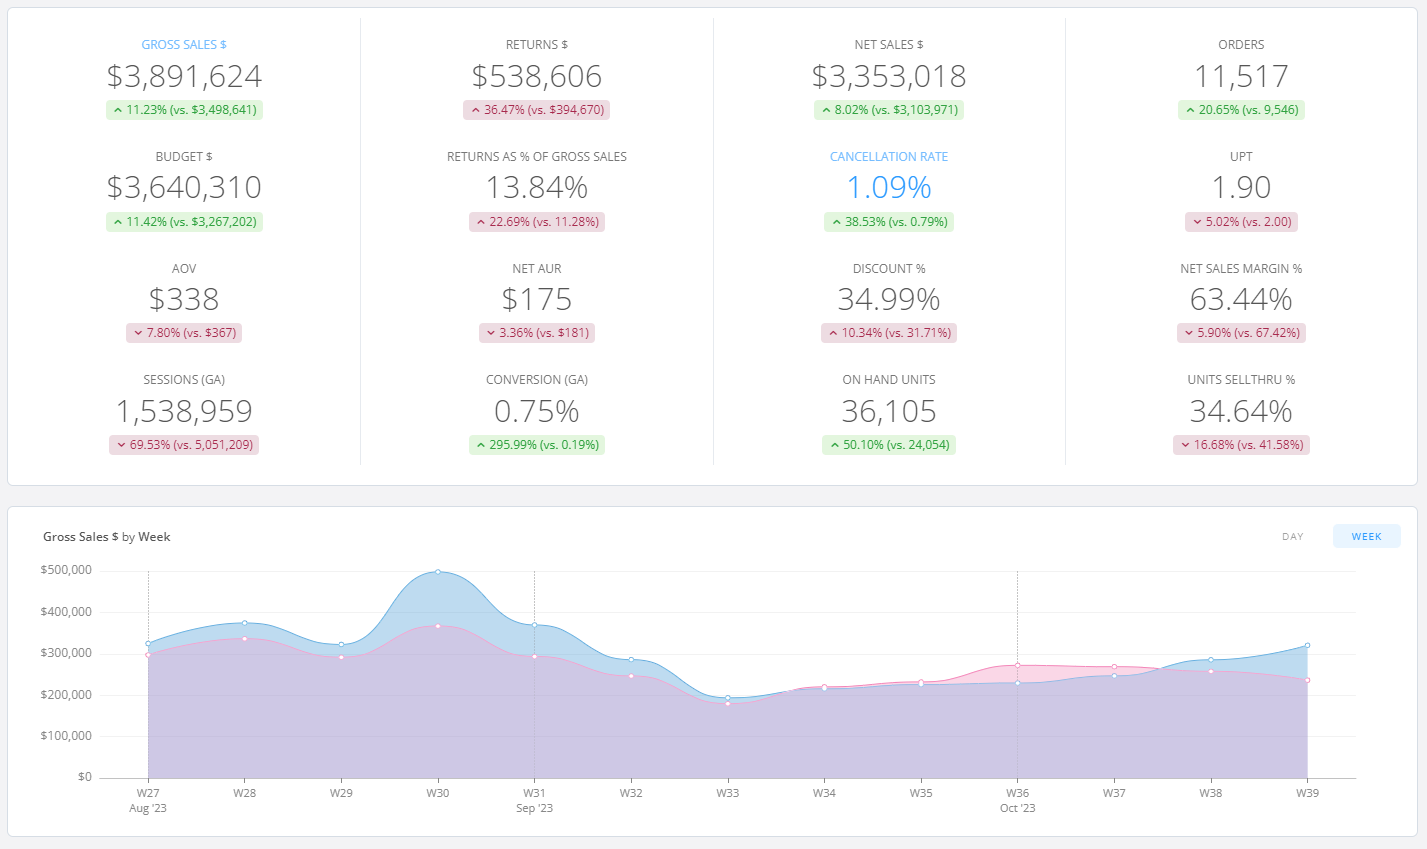
All of the above is why 42 created our retail analytics platform with actual busy humans in mind. No more endless spreadsheets, no more manual report creation; all the data and views your team needs is in a clickable dashboard that’s easy to drill-down to gain the actionable insights that good data should provide.
And it’s a time-saver. Here are just a few ways 42 goes about it:
- Implementation: other platforms have your engineers plug into their systems. Instead, you point us to your data sources and our engineers integrate your data for you, configuring it to the way you want. This setup process typically takes just a few clicks and our engineering team does the heavy lifting.
- Visualization: So much time spent in Excel is actually manipulating raw data into charts to convey information to your own team. That’s all done automatically with interactive, visual charts that are created on-the-fly with a click of your mouse. Most 42 users don’t export to Excel at all, and prefer to view and manipulate their data right on the platform. This aspect alone can save hundreds of hours for your team over the course of a business year.
- Automation: No more manual import/export of data. No more manual pulling of reports. No more manual data exceptions that someone has to filter out. All the data from all your sources are automatically imported, processed, and made accessible. Even custom reports can be scheduled for your team, and exceptions can be pre-excluded as well.
- Aggregation: Modern retailers pull data from a slew of different sources:
- Inventory from (Enterprise Resource Planning) ERP systems (ie Netsuite, RLM)
- Point of Sale system (ie Newstore, Teamwork)
- Ecommerce platforms (ie Shopify, Magento)
- In-store traffic (ie Shoppertrack, Retail Next)
- Google analytics
- Social Media
The list goes on and on. 42 aggregates all these sources for retail teams, providing them a one-stop-shop for their data.
Easier, intuitive reporting leads to higher data-usage and analytics for retail teams. We’ve seen it first hand, and it makes sense: when it’s not a pain to pull reports or to find the analysis you’re looking for, you’re much more likely to leverage data to take action. This is how a company’s culture changes from data-adverse, to data-driven.
The proof is in our customer feedback as well. Working with some of the top retail brands, we know we save teams time when we pull quotes such as these:
- “42 saves time, and it has everything. I can go back to like 2019 and still see sales. If I want to pull that out of Shopify, I have to pull 10 different reports because of how much data is housed in there and how clunky and slow it is.”
- “I used a bunch of VLOOKUPs in Excel to create my own reports, but as we got bigger and added more SKUs, there would be anomalies. It became clear we would need something more.”
- “We have 200 million rows of stock data, and 5 million rows of sales data every week. Our product file is 50 million rows. Excel can fit 1 million. The amount of data doesn’t fit into Excel.”
Data reporting and analytics aren’t useful if they are a pain to pull and view. Make your data more actionable with a data platform that will actually get used by your team.
Not all analytics platforms are created equal. See how 42 is built from the ground up with busy retail teams in mind. Sign up for a free demo of our retail analytics tool today.